An inverted yield curve is one of the market’s most reliable recession indicators, and has predicted seven of the last recessions in the United States.
We’ll explain in this article the yield curve, and discuss why it inverts. Most importantly, we’ll discuss what to do when the yield curve inverts.


What is a Yield Curve?
A yield curve plots the interest rates of similar bonds that have differing maturity dates. The most popular yield curve compares the 3 month, 2 year, 5 year, 10 year, and 30 year US Treasury debt.
The US Treasury debt yield curve gauges the rest of the debt market, such as bank lending or mortgage rates, as well as to predict economic growth.
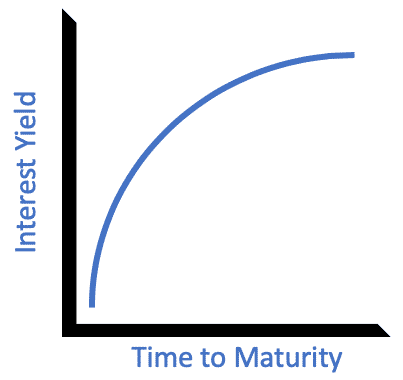
Typically, investors want to be paid more interest for longer holding periods. Longer holding period mean their capital is tied up, and the higher interest rates will pay for that lack of flexibility.
Therefore, short-term rates should be lower than long-term rates. This is known as a normal yield curve.

What Does an Inverted Yield Curve Mean?
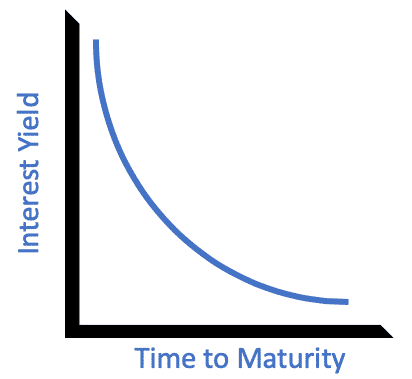
When the yield curve inverts, short-term rates are higher than long-term rates. Why would people be willing to buy bonds that have lower interest rates than shorter term bonds?
Typically, this is because investors are pessimistic about the future. This pessimism could signal that a bear market is on the horizon.

How the Yield Curve Inverts
Let’s start with a normal supply and demand graph. Investors are willing to pay a certain price for bonds based on the interest it returns.
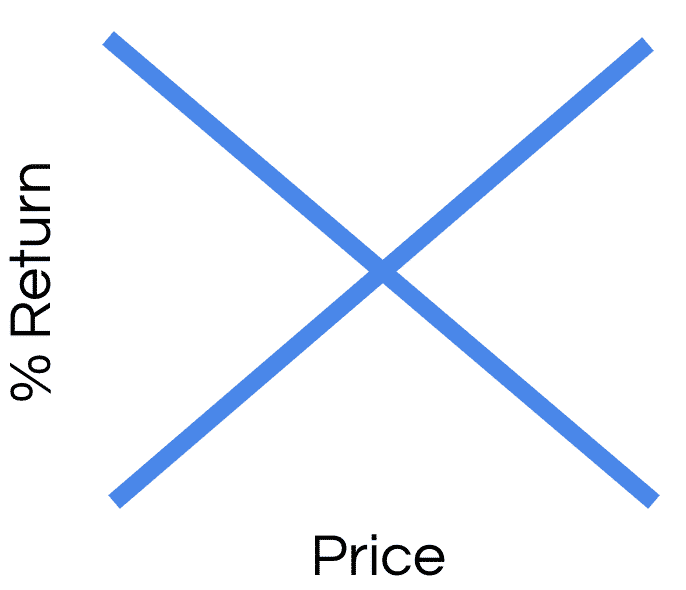
As investors worry about the long term prospects of the economy, they’ll move more money from risky investments like stocks to safe investments like bonds.
This pushes demand up for bonds, which ultimately pushes up the price. As the price goes up, their rate of return goes down.

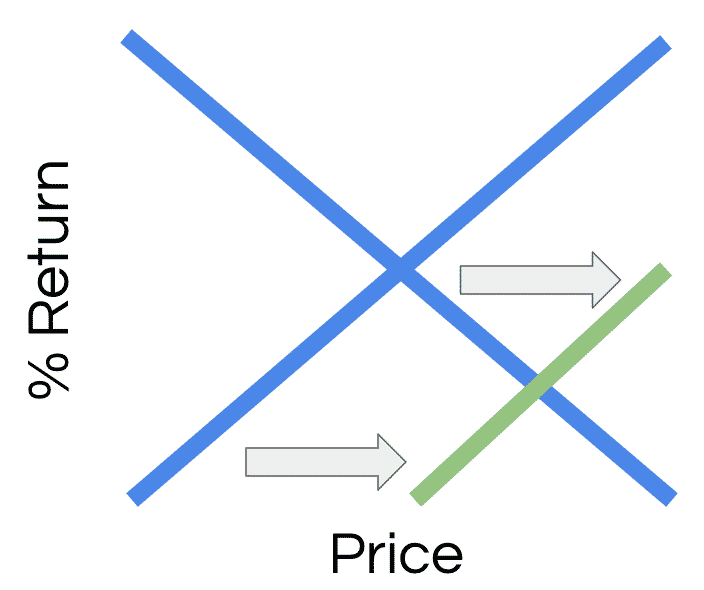
As you can see, the price of bonds have increased due to high demand, which brings the % return down. When demand for bonds gets high enough, long-term bond yields could go below short term bonds.
Once long term bond yields go below short term bonds, you have an inverted yield curve.
Does the Yield Curve Forecast a Recession?
Unfortunately, the answer is not black and white. The yield curve has inverted before each of the last seven recessions, but there have been some false positives as well.
Specifically, the yield curve inverted in 1998 and 1965 without recessions. Furthermore, the yield curve has an awful international record. It has a poor record in the United Kingdom, has not worked at all in Japan, completely missed the 2008 recession in Germany.
Additionally, the yield curve can’t predict how far away the recession is. The last time the yield curve inverted in 2006, the recession did not happen until 2008.
Finally, the yield curve needs to be consistent to signal a recession is on the horizon. Professor Campbell Harvey of Duke University concluded that yield curves need to be inverted for at least a quarter to provide a strong recession signal.
What Should You Do When the Yield Curve Inverts?
When the yield curve inverts, the last thing you should do is panic and sell your equities.
We already learned that the yield curve needs to be inverted for at least a quarter in order for it to be a strong recession signal. Even then, the recession could still be years away.
Keep an eye on the inverted yield curve and see how long the curve lasts. You have a solid recession signal if the yield curve stays inverted for over a quarter.
Prioritize your hierarchy of savings, and consider converting some of your equities to cash. Convert more equities to cash as the inverted yield curve gets more pronounced, and use that cash to capitalize on cheap stocks once the bear market comes.
Inverted Yield Curve – The Bottom Line
The yield curve is one of the strongest signals for a recession, which is why writers push the panic button once it occurs.
Since the inverted yield curve has predicted seven of the last recessions, the concern is certainly justified. With that said, we also know that the signal is not strong if the yield curve does not last longer than a quarter, and it has predicted false positives in the past.
Stay calm, and use the lag between the signal and recession to put more cash on the sidelines. If the recession does come, you’ll have an incredible opportunity to buy stocks that are on sale.